Kalinski: Boulder Valley real estate – Rear and forward view

 The year 2019 was another very good year for residential real estate in the Boulder Valley, but unlike the previous five-plus years, it was marked by slowing appreciation, slightly rising inventory (finally), and longer average time on the market.
In Boulder County, median and average sales prices of single-family homes increased by a very modest 1 percent, while attached dwelling (condos and townhomes) appreciation was essentially flat. In the city of Boulder, the average single-family home sales price increased a modest 2.6 percent to an immodest $1,246,250, while attached dwellings increased 2.4 percent to $538,360.
Single-family listing inventory in Boulder County reached a peak of 1,058 homes and attached dwellings topped out at 370 units on the market, both reaching their peak in June, and both above the peak inventory of the last several years. To put this in perspective, however, the inventory of single-family homes in 2006 (just before the Great Recession) reached a peak of 2,763, more than two-and-one-half times the peak of 2019. That is, we still have far less inventory available than we used to.
SPONSORED CONTENT
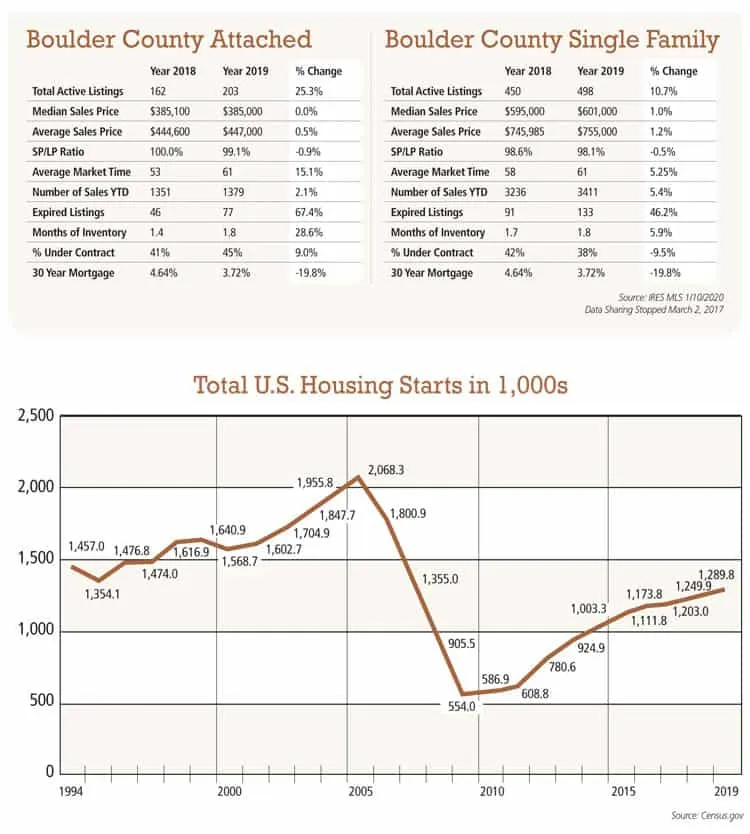
The average number of days homes stayed on the market before closing reached 61 days, an increase over last year by 5.2 percent for single-family homes and 15.1 percent for attached units. The average months of inventory (the time it would take for all existing homes to sell if no additional homes came on the market) rose to 1.8 months, an increase of 6 percent for single-family homes and 28.6 percent for attached units. By traditional standards, this would still qualify as a seller’s market (when months’ of inventory is in the 5-6 percent range, it is considered a balanced market, and we are still a long way from that). Charts on top show a snapshot of the Boulder County 10 vital statistics we track to gauge the market.
So, what is going on? Why do the months’ of inventory indicate that we’re in a strong seller’s market when many of the other metrics are pointing toward a more balanced market? And what can this tell us about 2020?
Explaining the months of inventory question
There appear to be a couple of key factors keeping our months of inventory much lower than historically. First, the nation as a whole — and Boulder County especially — have been building far fewer new homes that we were building pre-Great Recession. This graph from census.gov illustrates the situation well:
In Boulder County, we are getting close to full buildout under our current zoning and land use regulations, meaning that unless they are amended, we will run out of available lots on which to build new housing. (In practicality, this means that neighboring counties will become our bedroom communities, as Boulder still has the lion’s share of jobs in our area and people will be forced to commute farther and farther.)
Thus, with people continuing to move into the area at a strong pace while building is lagging behind, demand will structurally continue to outpace supply.
Second, people are staying in their homes longer than they used to. In 2010, homeowners nationwide stayed in their homes an average of eight years before selling. By 2019, that figure had increased to 13 years. With people selling less frequently, inventory goes down and, with strong demand like we have in Boulder, months of inventory stays low, too.
In Boulder, this issue is exacerbated by the fact that a lot of our homeowners are older (the National Association of Realtors reports that homeowners 73 years and older stay in their homes for an average of 17 years) and many of these Boulderites want to continue to age in place. Moreover, the Boulder Valley does not have a lot of options for the elderly looking to downsize and stay in their current community.
Accordingly, housing turnover is lower than it used to be, and this trend is likely to be even stronger in Boulder, further suppressing inventory.
So what?
For 2020, it appears that our available housing inventory will continue to be reined in by the structural impediments of inability to build sufficient new housing and current homeowners staying in place. That will put upward pressure on prices. Continued migration into our area fueled by our (currently) robust economy will keep demand high and put additional upward pressure on prices. Additionally, our return to very low interest rates will allow more potential buyers to qualify for our expensive property than would have otherwise been the case.
On the other side of the equation, home prices have risen so high (especially in the city of Boulder) that, even with low interest rates, the pool of buyers able to buy in our area will be relatively small. Moreover, the political uncertainty of election years can cause people to take fewer risks (such as buying a home). The fact that this promises to be an especially colorful election cycle will likely be a drag on demand as we get closer to November.
Based on the foregoing, if I had to make a prediction, I would suspect that the first part of the year will have very strong activity, with prices rising and multiple offer situations being not uncommon. Then, I suspect that the market may cool as we get closer to the election, which may be an especially good time to buy for those with intestinal fortitude.
Jay Kalinski is broker/owner of Re/Max of Boulder.
 The year 2019 was another very good year for residential real estate in the Boulder Valley, but unlike the previous five-plus years, it was marked by slowing appreciation, slightly rising inventory (finally), and longer average time on the market.
In Boulder County, median and average sales prices of single-family homes increased by a very modest 1 percent, while attached dwelling (condos and townhomes) appreciation was essentially flat. In the city of Boulder, the average single-family home sales price increased a modest 2.6 percent to an immodest $1,246,250,…


